§01 · The platform

What the company actually builds.

Most organisations already have sustainability policies, targets and public commitments. In the company’s account of the problem, the evidence, methods, risks and decisions behind them remain scattered across spreadsheets, documents and inboxes, and the question shifts from what did you report to what can you show.

Everything on this page is the company’s own description of itself, taken from sustaintrue.com. The product screens shown are the company’s own images and are labelled by the company as representative data rather than a client position.

ESG Policy vs Practice Assessment

Proprietary survey and assessment technology that finds where goals and practice diverge.

The company describes it as easy to deploy across your organisation, teams, and supply chain, so you can close the gaps that matter. It is the input layer that feeds the rest of the platform.

  • Structured methodology aligned to global frameworks
  • Deploys across teams, business units and suppliers
  • Feeds risk, carbon, disclosure and governance reporting
ESG Policy vs Practice Assessment on sustaintrue.com

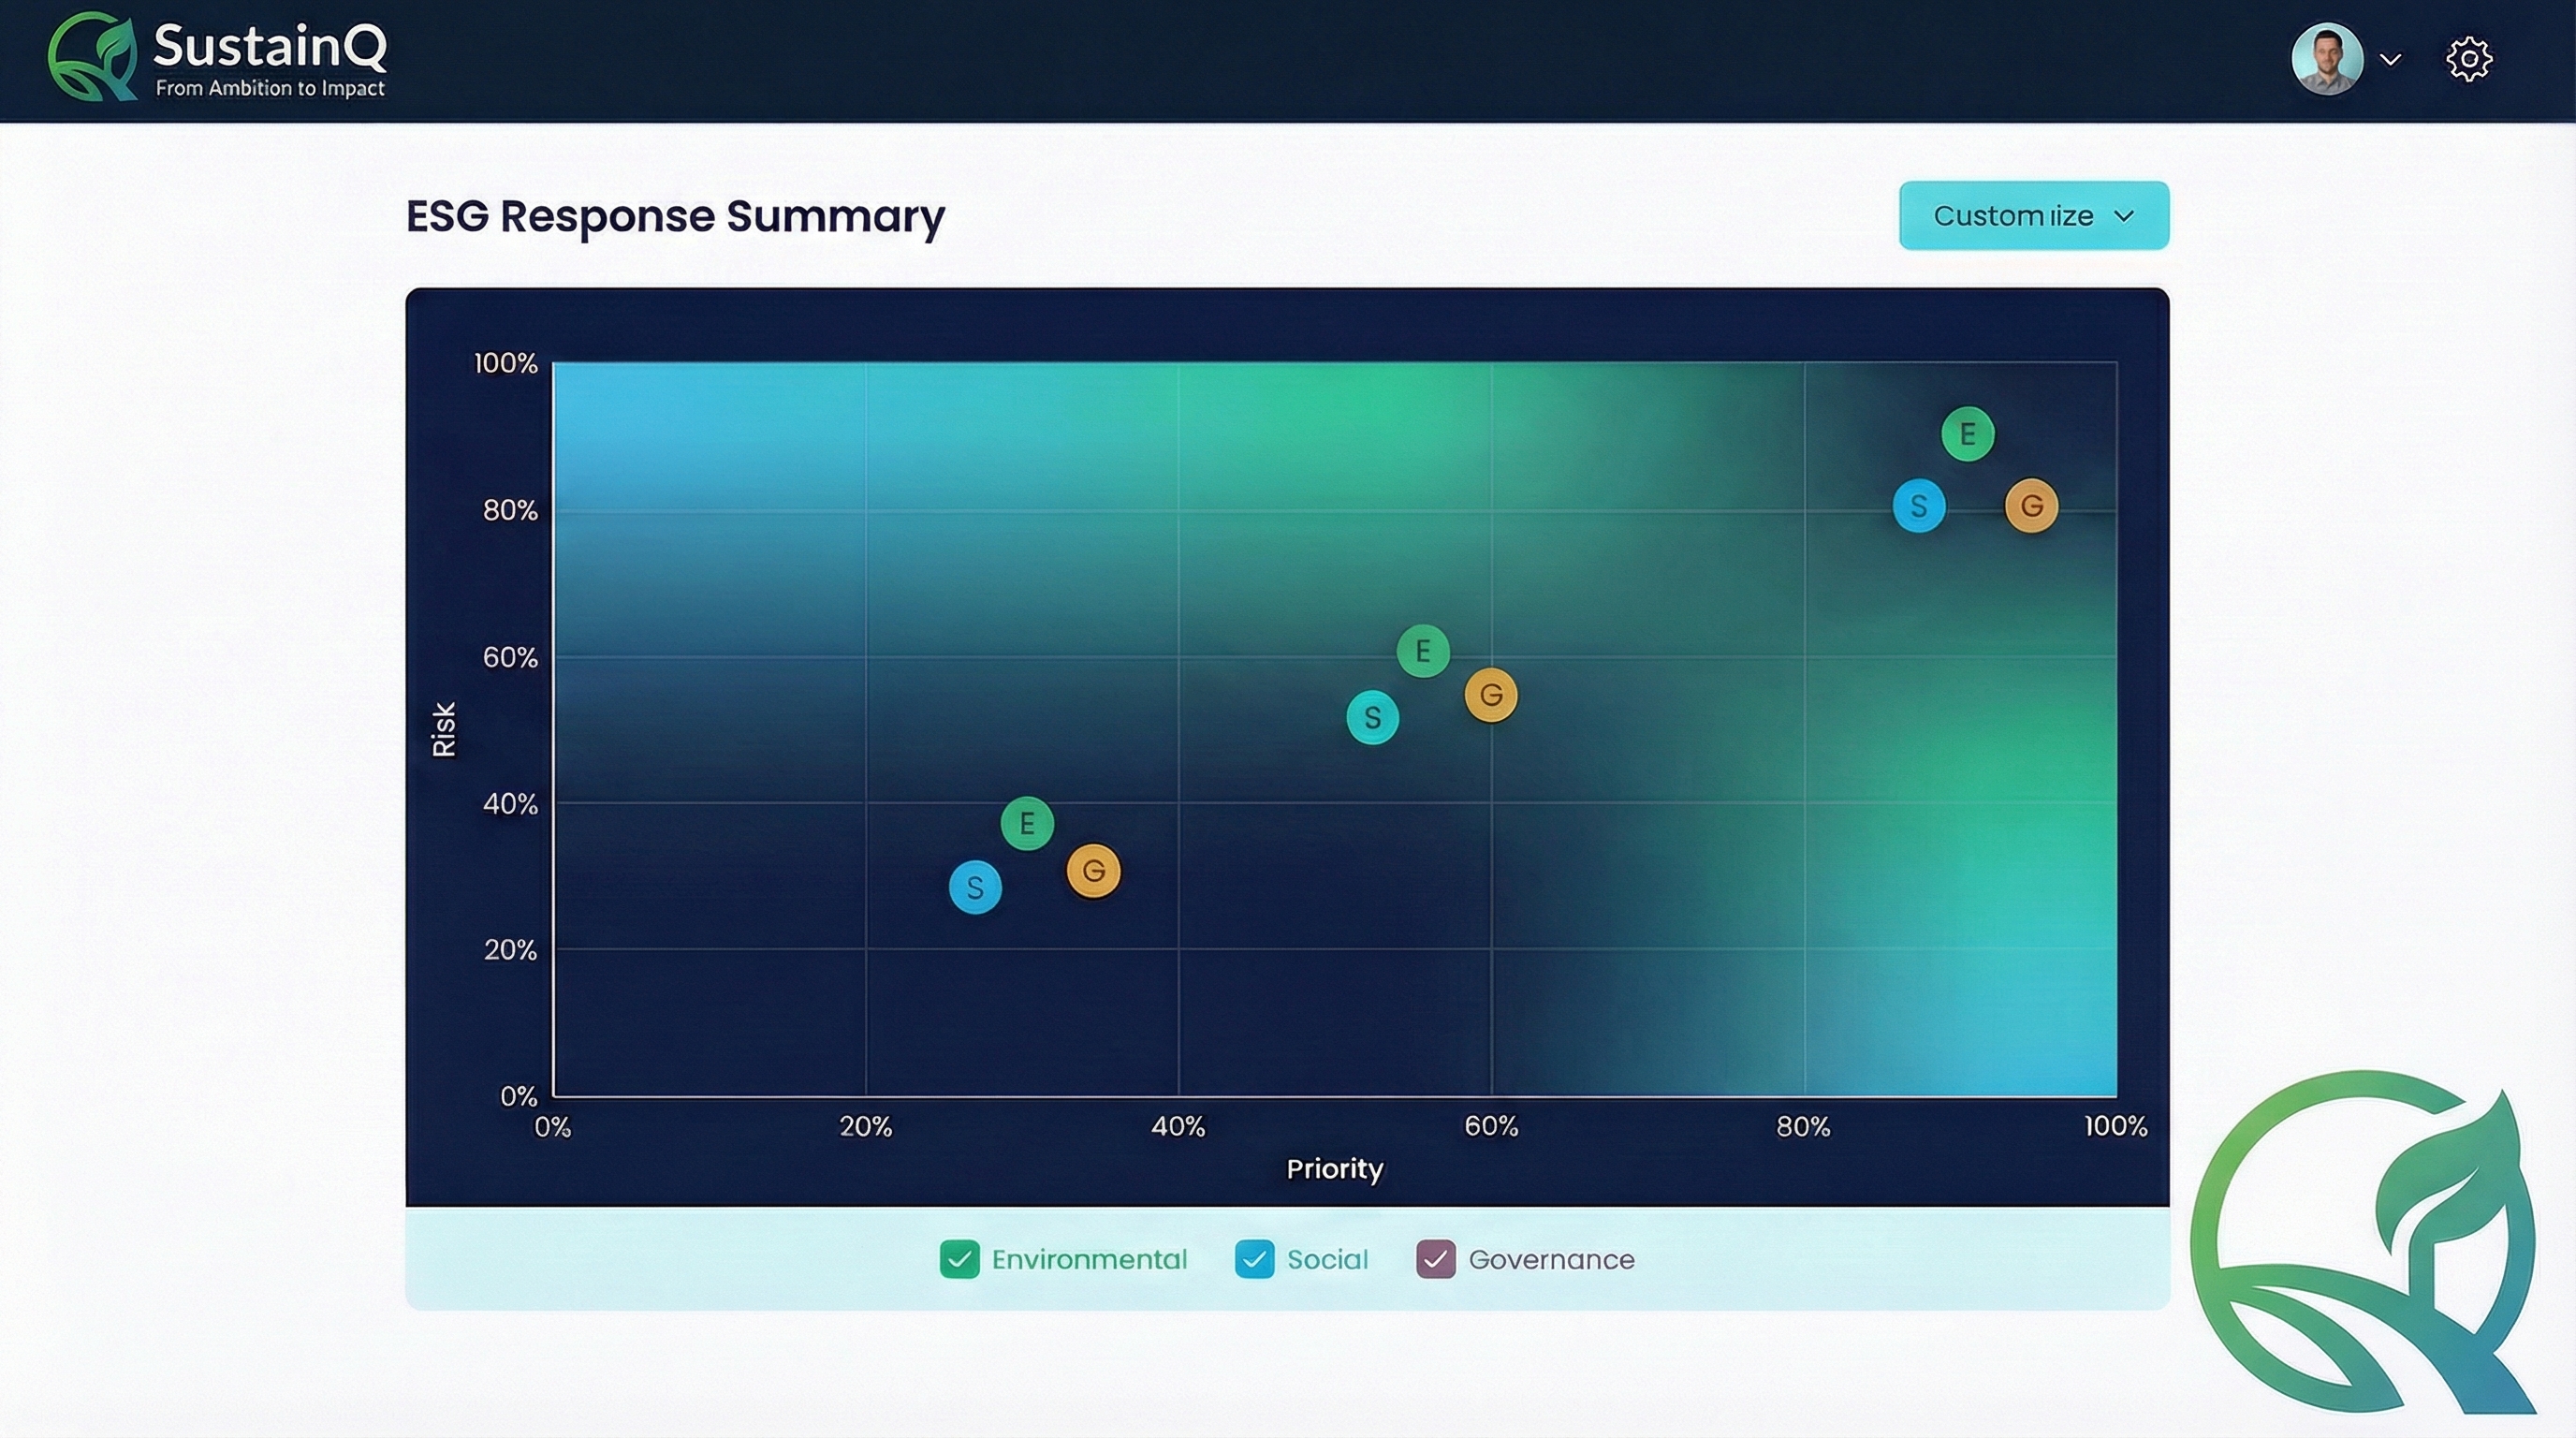
SustainQ ESG response summary from the Policy vs Practice assessment
ESG Risk and Dissonance Analysis

Multi-dimensional risk analysis built around the proprietary Dissonance Meter.

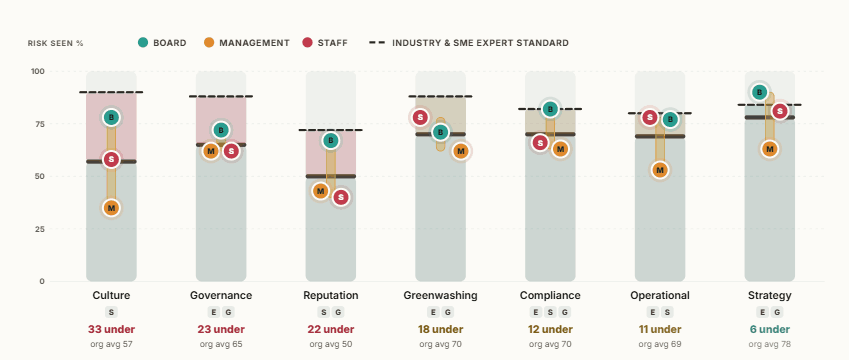
The meter shows how sustainability priorities align across Board, Management and Staff, and where the gaps create risk. The company frames the underlying exposure as greenwashing risk, and reads seven proprietary risks separately by Board, Management and Staff against an industry and expert standard.

  • Board, management and staff read separately
  • Seven proprietary risks against an industry and expert standard
  • Greenwashing exposure made visible

ESG Risk and Dissonance Analysis on sustaintrue.com

SustainQ ESG risk assessment card reading seven proprietary risks by Board, Management and Staff
Carbon Accounting and Emissions

Spend and activity-based carbon accounting across Scope 1, 2 and 3.

The company’s claim: your data in, your carbon footprint out, in minutes rather than months. A comprehensive emission factors database, simple data input, and as deep into the supply chain as you need to go. Offered in two tiers, Essential and Advanced, described as AI-accelerated.

  • Spend and activity-based models
  • Proprietary emission factors database
  • Essential and Advanced tiers
Net Zero and Transition Planning

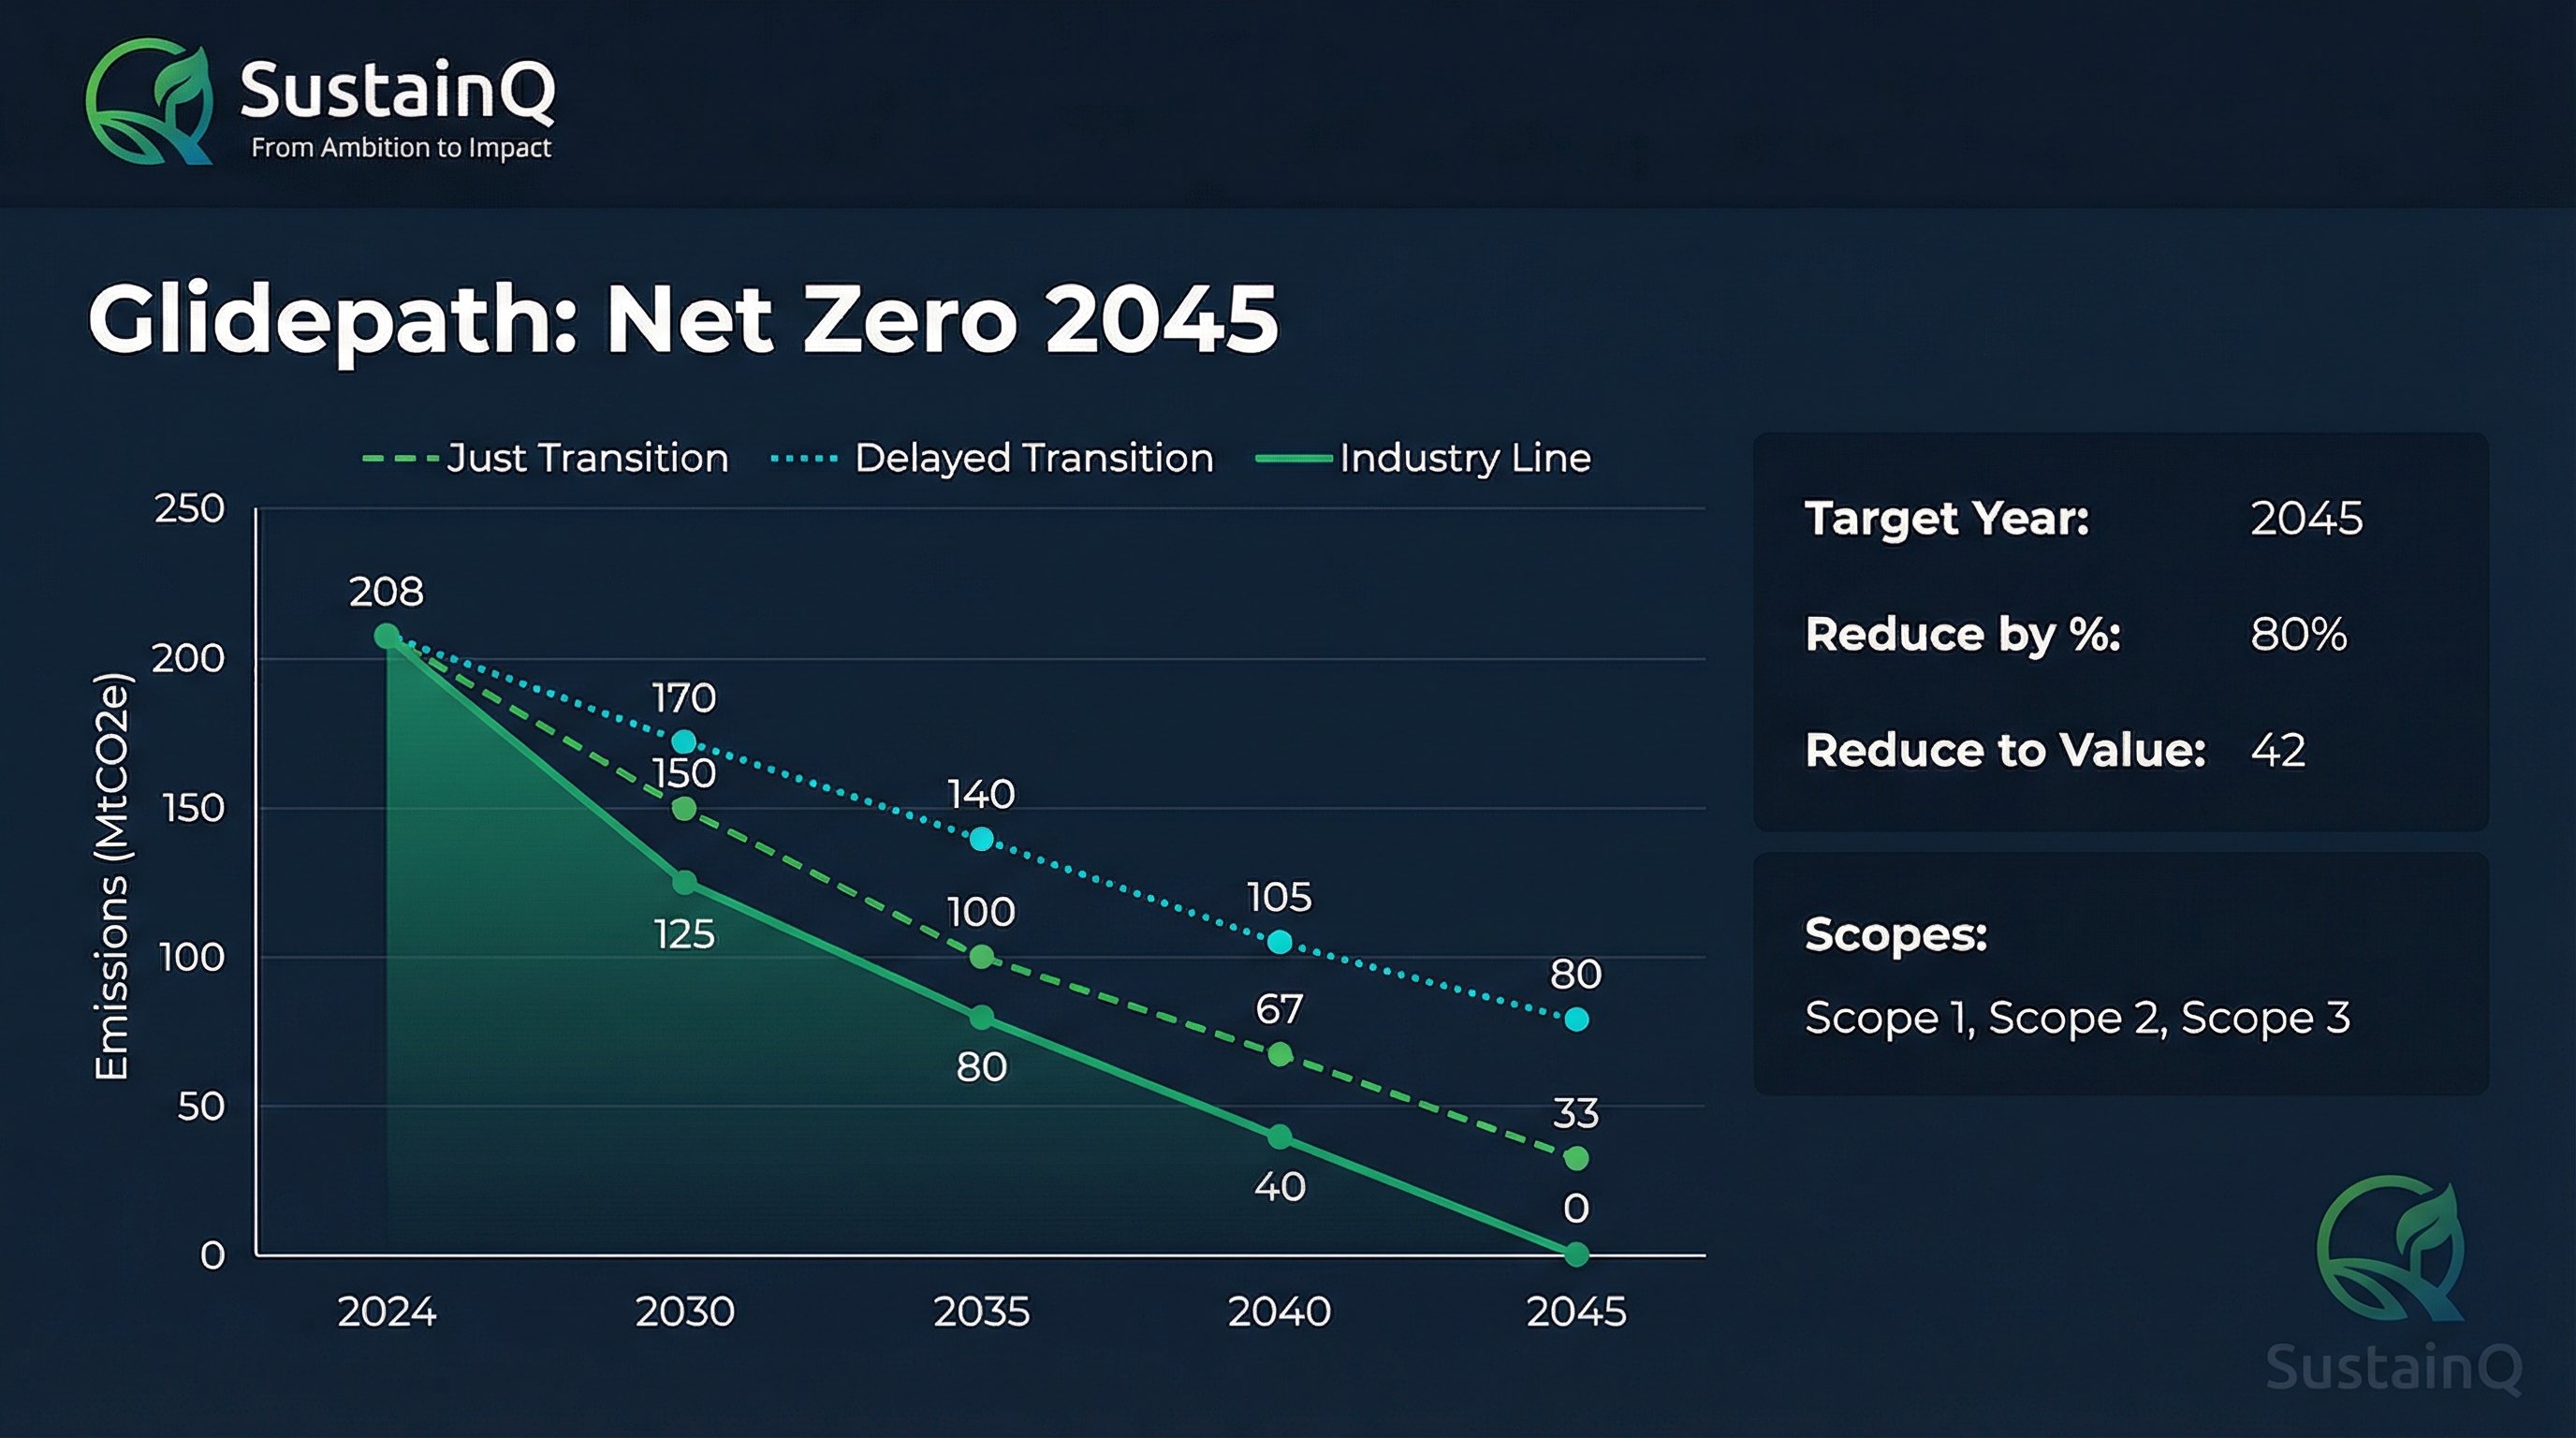
Scenario stress testing, transition plan modelling and initiative tracking.

Scenario analysis runs against NGFS, IPCC and SBTi science frameworks, with modelled pathways spanning orderly, disorderly and hot-house cases. Monte Carlo is listed among the scenario capabilities.

  • NGFS, IPCC and SBTi science frameworks
  • Orderly, disorderly and hot-house pathways
  • Initiative tracking against the glidepath

Net Zero and Transition Planning on sustaintrue.com

SustainQ net zero glidepath modelling a just transition against a delayed transition
Climate Disclosure Output

Audit-ready disclosures mapped to AASB and ASRS S1 and S2, ISSB, UK SRS and CSRD.

SustainQ maps every obligation to an owner and a piece of evidence, ranked so you can see exactly where to focus, and auto-tags inputs for audit readiness. Disclosure readiness is reported by pillar: strategy, compliance, governance, operational and reputation.

  • Every obligation mapped to an owner and evidence
  • Readiness reported by pillar
  • Evidence-based, traceable and assurance-ready
True-Source Data Collection

Bottom-up data, not top-down estimates.

Proprietary bottom-up collection that the company says feeds everything: risk assessments, carbon accounting, disclosures and governance. Purpose-fit and industry-specific, with supply chain depth the client sets.

  • Organisation-wide aggregation across teams and suppliers
  • Supply chain depth you set the boundary on
  • Proprietary emission factors from public and private data
Physical climate risk

Average Annual Loss for every site across its physical hazards.

Zoom into a site, switch scenarios to reprice, and colour the map by risk, hazard or value. Hazards modelled include bushfire, extreme wind, extreme heat, flood, coastal and cyclone, on NARCliM2.0, CCIA, NCRA, Geoscience Australia and CSIRO hazard data.

  • Asset-level pricing per site and scenario
  • Bushfire, wind, heat, flood, coastal and cyclone
  • Australian public hazard datasets
The SustainTrue Harness

The engineering layer beneath the products.

The company’s name for what holds its agentic architecture together. Its published components are tools and resources, session, sandbox, and orchestration. Its own analogy: most AI hands you a picture of a car, some hand you the body and leave you to fit the engine, wiring and wheels; we build the self-driving car that takes you to the destination.

  • Bounded sessions with rules and context built in
  • Model council and adversarial checks in the sandbox
  • Testing and acceptance runway, trusted execution lanes